Overview Last updated: Januray 20th, 2020
The PACSLAC II Checklist is used to screen for pain in older adults who have dementia or other cognitive impairment with a limited ability to communicate.
Glossary
Definition of the terms used throughout the project
- PACSLAC II: Pain Assessment Checklist for Seniors with Limited Ability to Communicate II
- User: can be the patient, caretaker or the person responsible for conducting research on pain levels across different groups.
- Patients: seniors with limited ability to communicate
- Heatmap: representation of data in form of a map in which data values are represented as colours
- Heatmap Calendar: a simple line graph, where the horizontal axis plots the time and the vertical axis plots the measured variable. The data is displayed in a format of heatmap.
- Institution: each hospital or care-home.
- Health-service zone: the way provinces set up their service zones
- Region: physiographic regions of Canada.
- Pain Level: a measurement(number) of patient’s pain intensity
Storyboarding
User Stories
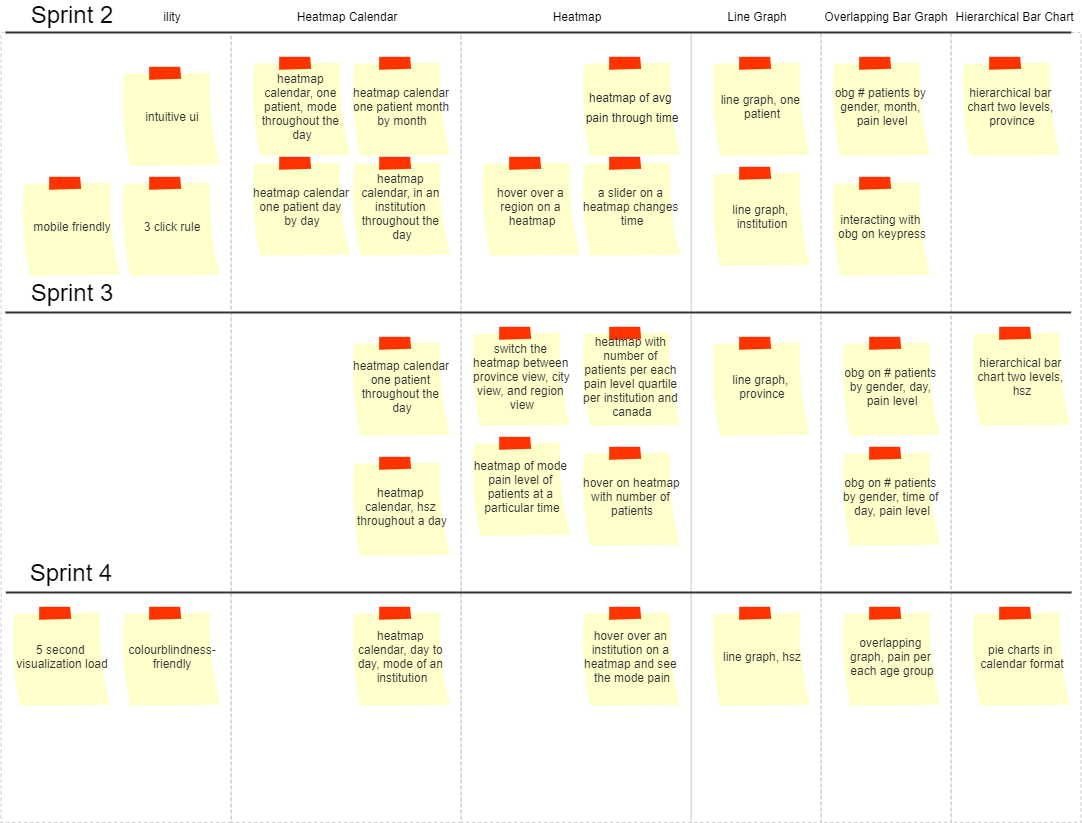
- As a user, I want to see a heatmap detailing average pain level of patients at a particular time, so that I can look for patterns.
Acceptance Tests: Heatmap loads on the screen. Map loads according to the correct average values for regions. Has instructions how to read it. - As a user, I want to hover over a region on a heatmap so that I may see average numeric pain scores for that region.
Acceptance Tests: The screen responds on hover within a second. The correct average pain score is displayed for a region. - As a user, I want to use a slider on a heatmap so that I may see how the pain scores change over time.
Acceptance Tests: The slider moves in response to the user mouse. The heatmap changes with slider movement. The range for the slider is an accurate representation of the ‘date’ data available. - As a user, I want to switch the heatmap between province view, city view, and region view so that I may see how they compare.
Acceptance Tests: Indicator with available view options is evident. The map displays province view if the province view is selected. Similar for every other view offered. The map zooms into the selected region. - As a user, I want to see a heatmap detailing the pain level mode of patients at a particular time so that I may know at what pain-level most patients are at any point in time.
Acceptance Tests: The correct mode “heat” level is displayed. The time of the displayed map is clearly displayed on the screen. The map shows the country. - As a user, I want to hover over an institution on a heatmap so that I may see the mode pain score for that institution.
Acceptance Tests: The map responds to hover. Institutions are obvious on the screen (as pins, or circles). The correct mode is displayed. - As a user, I want to hover over an institution on a heatmap so that I may see the number of patients in that institution.
Acceptance Tests: The map responds to hover. The correct number of patients is displayed. - As a user, I want to see an overlapping bar-graph on the number of patients by registered gender (colour), time of day assessed (bottom/adjustable) and pain levels (bottom) so that I may see the distribution of men/women at different pain levels over time.
Acceptance Tests: The colours of the bar graph are different but complement each other. The axes are clearly labeled. The correct values are displayed for the columns, testing maybe only two. No values overlapping over each other anywhere. Has a title. Has a legend. Has instructions on how to read it. Loads on the screen. - As a user, I want to see an overlapping bar-graph on the number of patients by registered gender (colour), day (bottom/adjustable) and pain levels (bottom) so that I may see the distribution of men/women at different pain levels over time.
Acceptance Tests: The graph is nice to look at. Has nice colour overlap. The correct values are displayed for each column. Axis values aren’t overlapping each other. Has a title. Has a legend. Has instructions on how to read it. - As a user, I want to see an overlapping bar-graph on the number of patients by registered gender (colour), month (bottom/adjustable) and pain levels (bottom) so that I may see the distribution of men/women at different pain levels over time.
Acceptance Tests: Graph is nice to look at. Has nice colour overlap. The correct values are displayed for each column. Axis values aren’t overlapping. Has a title. Has a legend. Has instructions on how to read it. - As a user, I want to interact with the overlapping bar-graph by pressing the left and right keys OR using a slider so that I may see more data.
Acceptance Tests: The graph responds to key presses. The graph has a slider. The graph responds to slider movement. As a colourblind user, I want to see all the colours on any of the visualizations.
Acceptance Tests: All visualizations use a colourblind friendly colour palette. - As a user, I want to see a heatmap calendar depicting the pain level of one patient day by day so that I may see how the pain level of a patient changed over time.
Acceptance Tests: The calendar loads. The correct colours are displayed for each day. Legend for what the colours mean. Has a title. - As a user, I want to see a heatmap calendars depicting the pain level of one patient month by month so that I can see how the pain level changed over a different time granularity.
Acceptance Tests: The calendars load and display consecutively one after the other. Has a title, and a legend for what the colours mean. - As a user, I want to see a heatmap calendar depicting the average pain level of one patient throughout a day so that I can see how the pain level changed over another time granularity.
Acceptance Tests: Data is displayed in a concise way. Has a title and colour legend. The correct colours are displayed for their respective values. - As a user, I want to see a heatmap calendar depicting the average pain level of patients in an institution throughout a day so that I may see what the overall pain level change for this group of patients.
Acceptance Tests: The average calculated correctly. Data is grouped properly. The colours correspond their numeric values. - As a user, I want to see a heatmap calendar depicting the average pain level of patients in a health-service zone throughout a day so that I can see the overall pain level change in this group of patients.
Acceptance Tests: The average calculated correctly. Data is grouped properly. Axes clearly labeled. - As a user, I want to see a heatmap calendar depicting the mode pain level of one patient throughout a day so I may see what pain level a patient is most often at throughout the day.
Acceptance Tests: The mode is calculated correctly. Colour legend. Title. - As a user, I want to see a heatmap calendar depicting the mode pain level of patients day to day of an institution so that I may see what level patients of an institution are most often at.
Acceptance Tests: The correct mode is calculated. Only the values of an institution are calculated. - As a user, I want to see a heatmap that shows the number of patients per each pain-level quartile in each institution and overall Canada so that I may see aggregate data.
Acceptance Tests: The quartiles are grouped appropriately. The correct number is displayed. - As a user, I want to see pie-charts in a calendar format of patients improving/deteriorating (as indicated with a regression line over their measurements) over time at an institution so that I may see an overview of all patients improving/deteriorating within a time period.
Acceptance Tests: Pie charts have complementary colours. The calendar loads. - As a user, I want to see an overlapping graph detailing the levels of pain so that I may see the distribution of pain levels across age groups.
Acceptance Tests: The data for the groups is accurate. The graph colours are well chosen for visibility. The axes are good scaled. Has colour legend. - As a user, I want to see a hierarchical bar chart where the first level is the number of patients in every institution within a health-service zone where each bar is coloured by pain level mode so that I may explore indicators of all patients.
Acceptance Tests: Accurate data. Axes clearly labeled. Has title. - As a user, I want to see a hierarchical bar chart where the second level is the number of patients per each pain-level quartile in an institution within a health-service zone so that I may continue to explore the indicators of all patients in an institution.
Acceptance Tests: Accurate data. - As a user, I want to see a hierarchical bar chart where the first level is the number of patients in every institution within a province where each bar is coloured by pain level mode so that I can explore indicators of all patients in a province.
Acceptance Tests: Accurate data. Axes clearly labeled. Has title. - As a user, I want to see a hierarchical bar chart where the second level is the number of patients per each pain-level quartile in an institution within a province so that I may see any general trends that may be happening.
Acceptance Tests: Displays accurate data. The colours are appropriate. - As a user, I want to see a line graph of each patient’s improvement/deterioration so that I may see any possible trends.
Acceptance Tests: Displays accurate data. Every aspect is clearly visible. Axes are accurate and not misleading. The graph loads. - As a user, I want to see a line graph of each institution’s improvement/deterioration so that I can see any trends if they’re happening.
Acceptance Tests: Displays accurate data. The graph loads. - As a user, I want to see a line graph of each province’s improvement/deterioration so that I may see how a province is doing.
Acceptance Tests: Displays accurate data. The graph loads. - As a user, I want to see a line graph of each health-zone’s improvement/deterioration so that I may evaluate how the health-zone is doing.
Acceptance Tests: Displays accurate data. The graph loads. - As a user, I want the UI to be intuitive to use, following general principles of navigation so that I don’t have to spend lots of time learning to interact with it
Acceptance Tests: The navigation is on the left. Clicking on a button will change the page to load the visualization. - As a user, I want the visualizations to load within 5 seconds so that I may have a good experience.
Acceptance Tests: Visualizations load within 5 seconds. Able to navigate mid load. If a user changes his mind about viewing a certain visualization, the system loads the new visualization rather than the old one. - As a user, I want to follow the 3-click rule to get to any visualization, so that I don’t get lost on the webpage.
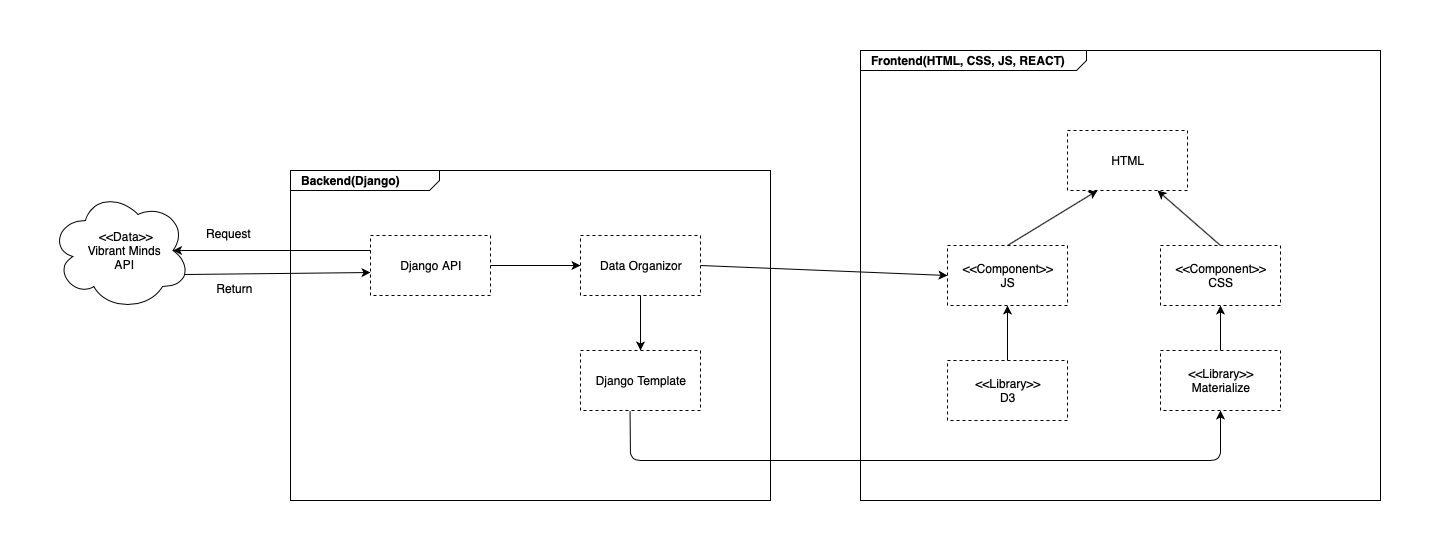
Acceptance Tests: Follows the 3-click rule. As a developer, I want to integrate a front-end React framework with a django back-end.
Acceptance Tests: Uses Django back-end. Uses React. As a developer, I want the visualizations mobile-friendly so that users get the best experience.
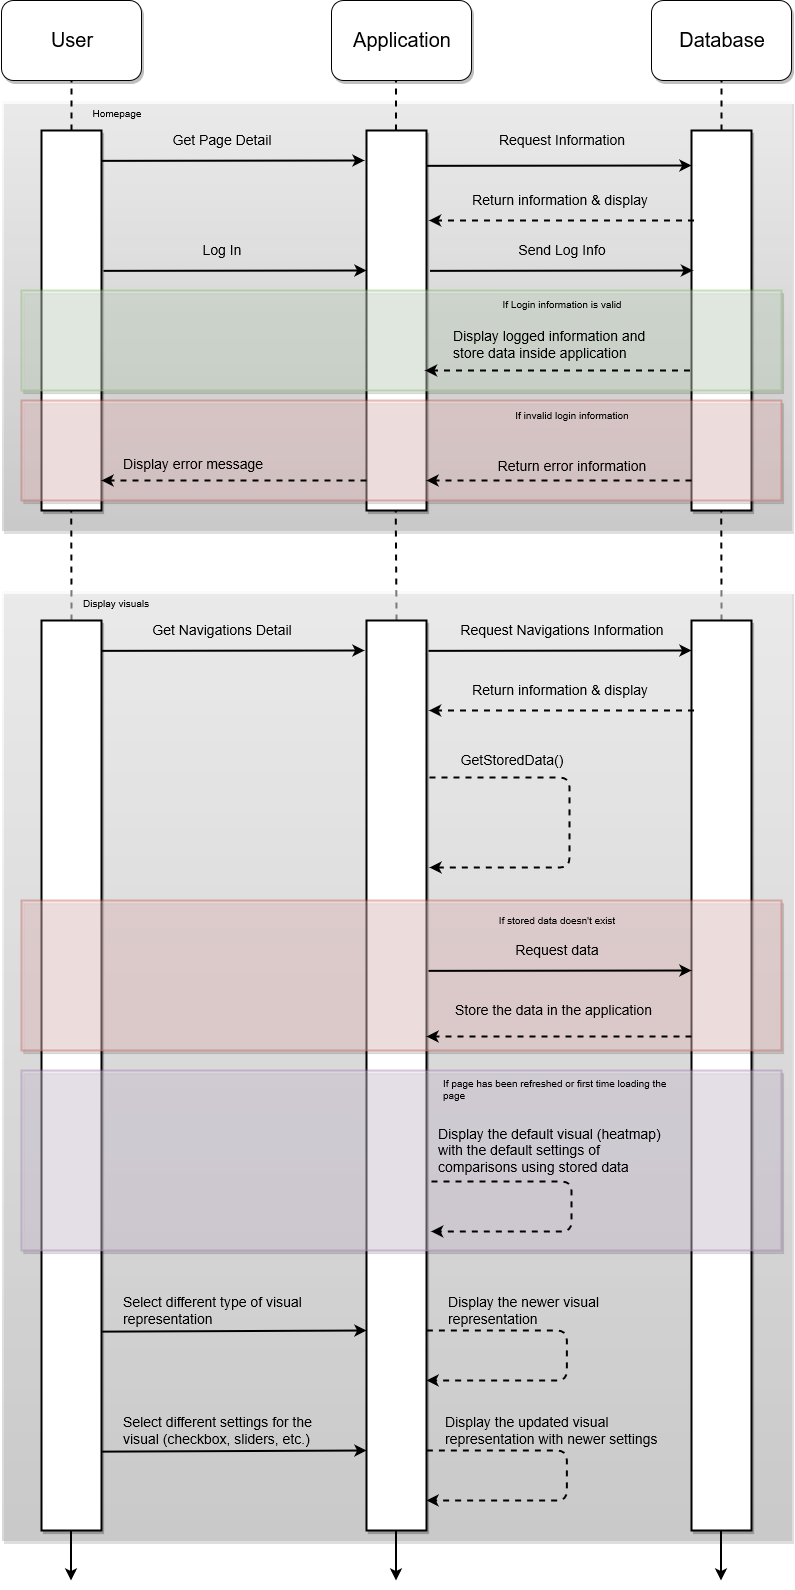
Acceptance Tests: Each visualization looks good on mobile. Can interact with each visualization on mobile. - As a user, I want to be able to register a new account with an email and a password, so that I may log in.
Acceptance Tests: The password is a strong password. Trying to log in with an unregistered password returns an error.
Similar Product
Similar Products/Inspiration:
| Sisense | Business Intelligence software by Sisense, the industry leader in BI for complex data - easily prepare, analyze & explore growing data from multiple sources. |
|---|---|
| SB Admin 2 | A free Bootstrap 4 admin theme built with HTML/CSS and a modern development workflow environment ready to use to build your next dashboard or web application |
| Chartlist | Create responsive, scalable and good looking charts with chartist.js. Chartlist.js is a javascript library that helps build responsive charts. |
| Population Pyramid | This diagram shows the distribution of age groups in the United States over the last 150 years. Use the arrow keys to observe the changing population. |
| Calendar View | This chart shows daily changes of the Dow Jones Industrial Average from 1990 to 2010. Days the index went up are green; days the index went down are pink. |
| Google Calendar-like Display | A simple Google calendar like display to visualize temporal data. Use the forward and backwards buttons to move through the months. |
| Cubsim | Cubism.js is a D3 plugin for visualizing time series. Use Cubism to construct better realtime dashboards, pulling data from Graphite, Cube and other sources. |
| Choropleth | Choropleth makes use of the famous javascript library, d3.js for visualizing heatmaps. Unemployment rate by county, August 2016. Data: Bureau of Labor Statistics. |
| Vis System | VIS components for a security system, to monitor the state and confirm the system's health running. All codes were wrote based on D3.js version 3.x. |